How-To-Tutorials · September 5, 2025
Debug STM32F4 with ST-Link and GDB: Real-Time Breakpoint Setup Guide

Introduction
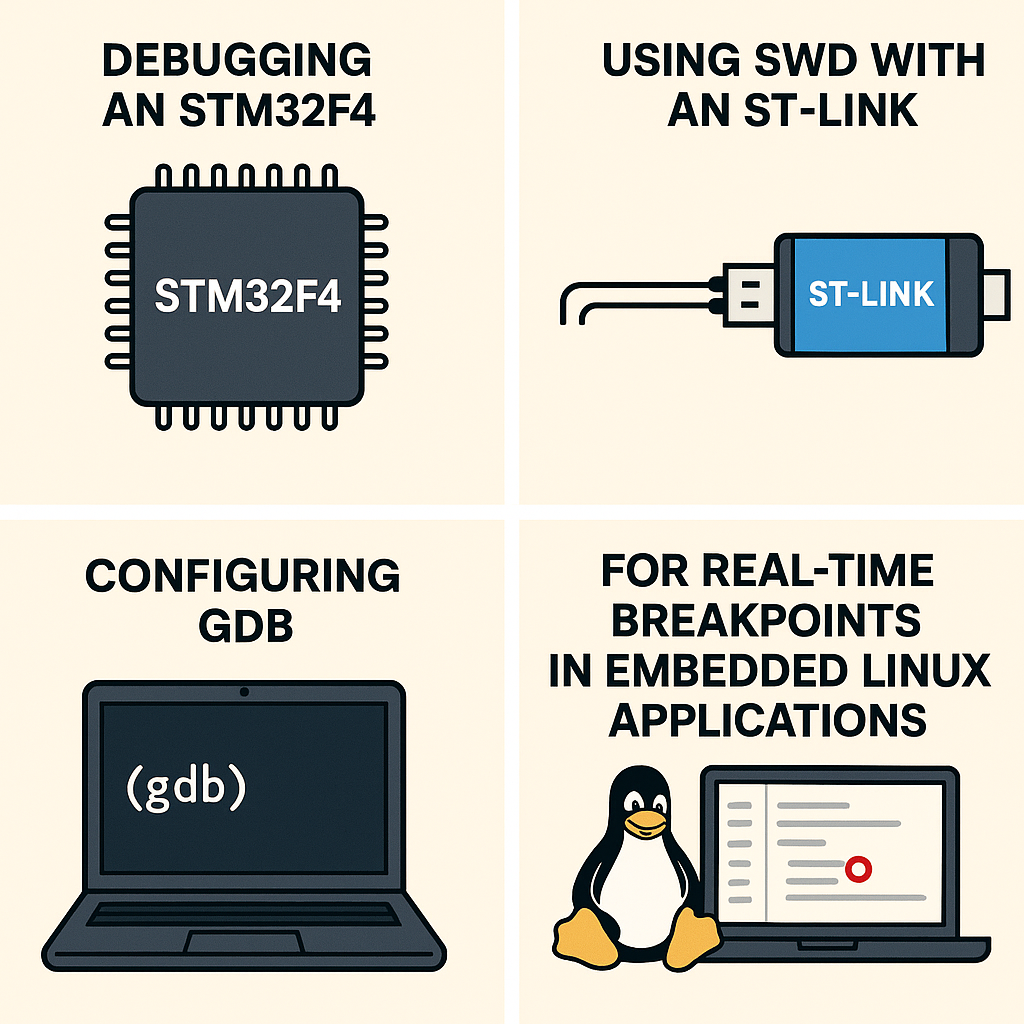
Debugging STM32F4 microcontrollers can be a complex task, but with the right tools and techniques, it becomes manageable. This tutorial will guide you through the process of setting up an ST-Link debugger and configuring GDB for real-time breakpoints in embedded Linux applications.
Prerequisites
- Basic understanding of embedded systems and C programming
- STM32F4 microcontroller board
- ST-Link debugger
- Development environment (Linux-based preferred)
- GDB installed on your system
- OpenOCD installed and configured
Parts/Tools
- STM32F4 Microcontroller
- ST-Link V2 USB Programmer
- Jumper wires for SWD connection
- Development IDE (e.g., Eclipse, VS Code)
- OpenOCD
- GDB (GNU Debugger)
Steps
- Connect the ST-Link to the STM32F4
- Identify the SWD pins on your STM32F4 board: SWDIO, SWCLK, and GND.
- Connect the wires as follows:
- ST-Link SWDIO to STM32F4 SWDIO
- ST-Link SWCLK to STM32F4 SWCLK
- ST-Link GND to STM32F4 GND
- Install OpenOCD
- Open a terminal and install OpenOCD using your package manager:
sudo apt-get install openocd - Verify the installation:
openocd --version
- Open a terminal and install OpenOCD using your package manager:
- Configure OpenOCD
- Create a configuration file (e.g.,
stm32f4.cfg) with the following content:interface stlink transport select hla_swd set CHIPNAME STM32F4xx source [find target/stm32f4x.cfg] - Start OpenOCD with the configuration file:
openocd -f stm32f4.cfg
- Create a configuration file (e.g.,
- Install GDB
- Install GDB if it is not already installed:
sudo apt-get install gdb
- Install GDB if it is not already installed:
- Compile your application with debugging symbols
- Use the
-gflag during compilation:gcc -g -o my_app my_app.c
- Use the
- Start GDB with your application
- Launch GDB with the compiled application:
gdb my_app
- Launch GDB with the compiled application:
- Connect GDB to OpenOCD
- In the GDB terminal, connect to OpenOCD:
(gdb) target remote :3333
- In the GDB terminal, connect to OpenOCD:
- Set breakpoints and run
- Set breakpoints in the code:
(gdb) break main - Run the application:
(gdb) continue
- Set breakpoints in the code:
Troubleshooting
- OpenOCD not starting: Check if the ST-Link drivers are properly installed and the ST-Link is connected.
- GDB connection issues: Ensure that OpenOCD is running and listening on the correct port (default is 3333).
- Breakpoints not hit: Verify that the application is compiled with debug symbols and matches the source code.
Conclusion
Debugging STM32F4 microcontrollers using SWD with an ST-Link and GDB can significantly enhance your development workflow. By following this tutorial, you’ve learned how to set up the necessary tools and configure your environment for effective debugging. Happy coding!