Introduction
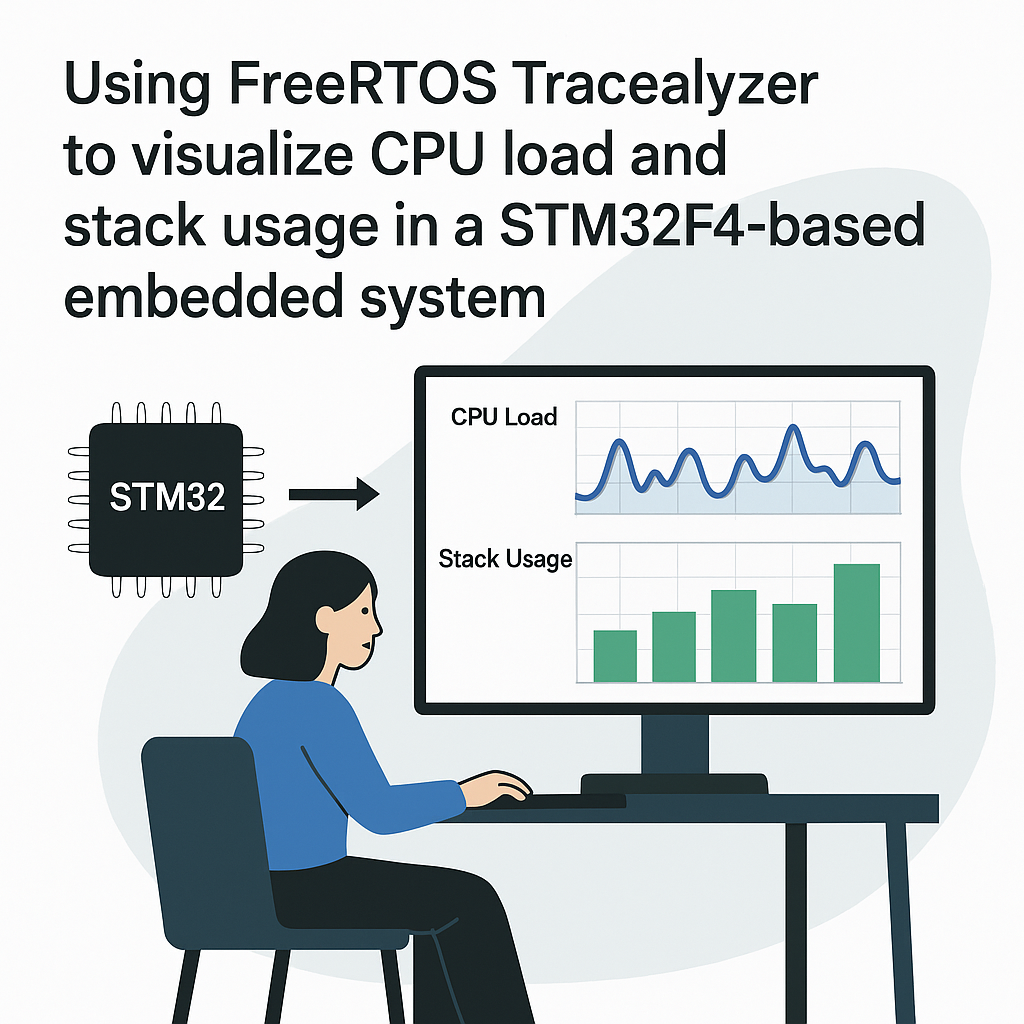
FreeRTOS Tracealyzer is a powerful tool for visualizing and analyzing the behavior of real-time systems. In this tutorial, we will go through the steps to set up and use Tracealyzer to monitor CPU load and stack usage in an STM32F4-based embedded system. You’ll learn how to integrate Tracealyzer with your FreeRTOS application and visualize important metrics to improve your system’s performance.
Prerequisites
- Basic understanding of FreeRTOS and embedded systems.
- STM32F4 development board.
- Keil MDK or STM32CubeIDE installed on your computer.
- FreeRTOS Tracealyzer license (free trial available).
- Tracealyzer software installed on your computer.
Parts/Tools
- STM32F4 development board
- USB cable for programming the board
- PC with FreeRTOS Tracealyzer installed
- IDE (Keil MDK or STM32CubeIDE)
Steps
- Set up your FreeRTOS project.
- Create a new FreeRTOS project in STM32CubeIDE or Keil MDK.
- Ensure you have the FreeRTOS source files included in your project.
- Integrate Tracealyzer into your project.
- Download the Tracealyzer FreeRTOS integration files from the official website.
- Copy the necessary files (e.g.,
trcConfig.h,trcRecording.c) into your project directory. - Include the Tracealyzer headers in your FreeRTOS configuration file:
#include "trcRecorder.h" #include "trcConfig.h" - Configure FreeRTOS for Tracealyzer.
- Define the following macros in your FreeRTOSConfig.h file:
#define configUSE_TRACE_FACILITY 1 #define configGENERATE_RUN_TIME_STATS 1 - Implement the function to get the run time counter (e.g., using a timer or a SysTick):
- Initialize Tracealyzer in your main function.
- Add the following initialization code in your
main()function:
vTraceEnable(TRC_START); // Start recording vTraceSetTimestamp(); // Set the timestamp - Add the following initialization code in your
- Build and upload your project to the STM32F4 board.
- Compile your project and ensure there are no errors.
- Upload the firmware to your development board using the IDE.
- Run your application and collect trace data.
- Run your application on the STM32F4 board.
- Allow it to run for a sufficient period to collect meaningful data.
- Stop the Tracealyzer recording by calling:
vTraceStop(); - Export the trace data.
- Use the following function to save the trace data to a file:
vTraceExport(); - Transfer the file to your PC for analysis.
- Analyze the data in Tracealyzer.
- Open Tracealyzer on your PC.
- Load the exported trace data file.
- Use the various visualization tools to analyze CPU load and stack usage.
unsigned long ulGetRunTimeCounterValue(void)
{
    return (unsigned long) xTaskGetTickCount();
}Troubleshooting
- Trace data not appearing: Ensure that Tracealyzer is properly initialized and that the recording is enabled.
- Build errors: Confirm that all required Tracealyzer files are included in your project and that the paths are correct.
- Incorrect stack usage readings: Verify that the stack size is correctly configured in your FreeRTOS tasks and that the task stack checking feature is enabled.
Conclusion
By following this tutorial, you should now be able to successfully integrate FreeRTOS Tracealyzer into your STM32F4 project, allowing you to visualize CPU load and stack usage effectively. Utilizing Tracealyzer can provide invaluable insights into your system’s performance, helping you optimize and debug your embedded applications.